The Geology of Mars
June 24 2019 · Link to the Open-Source Code
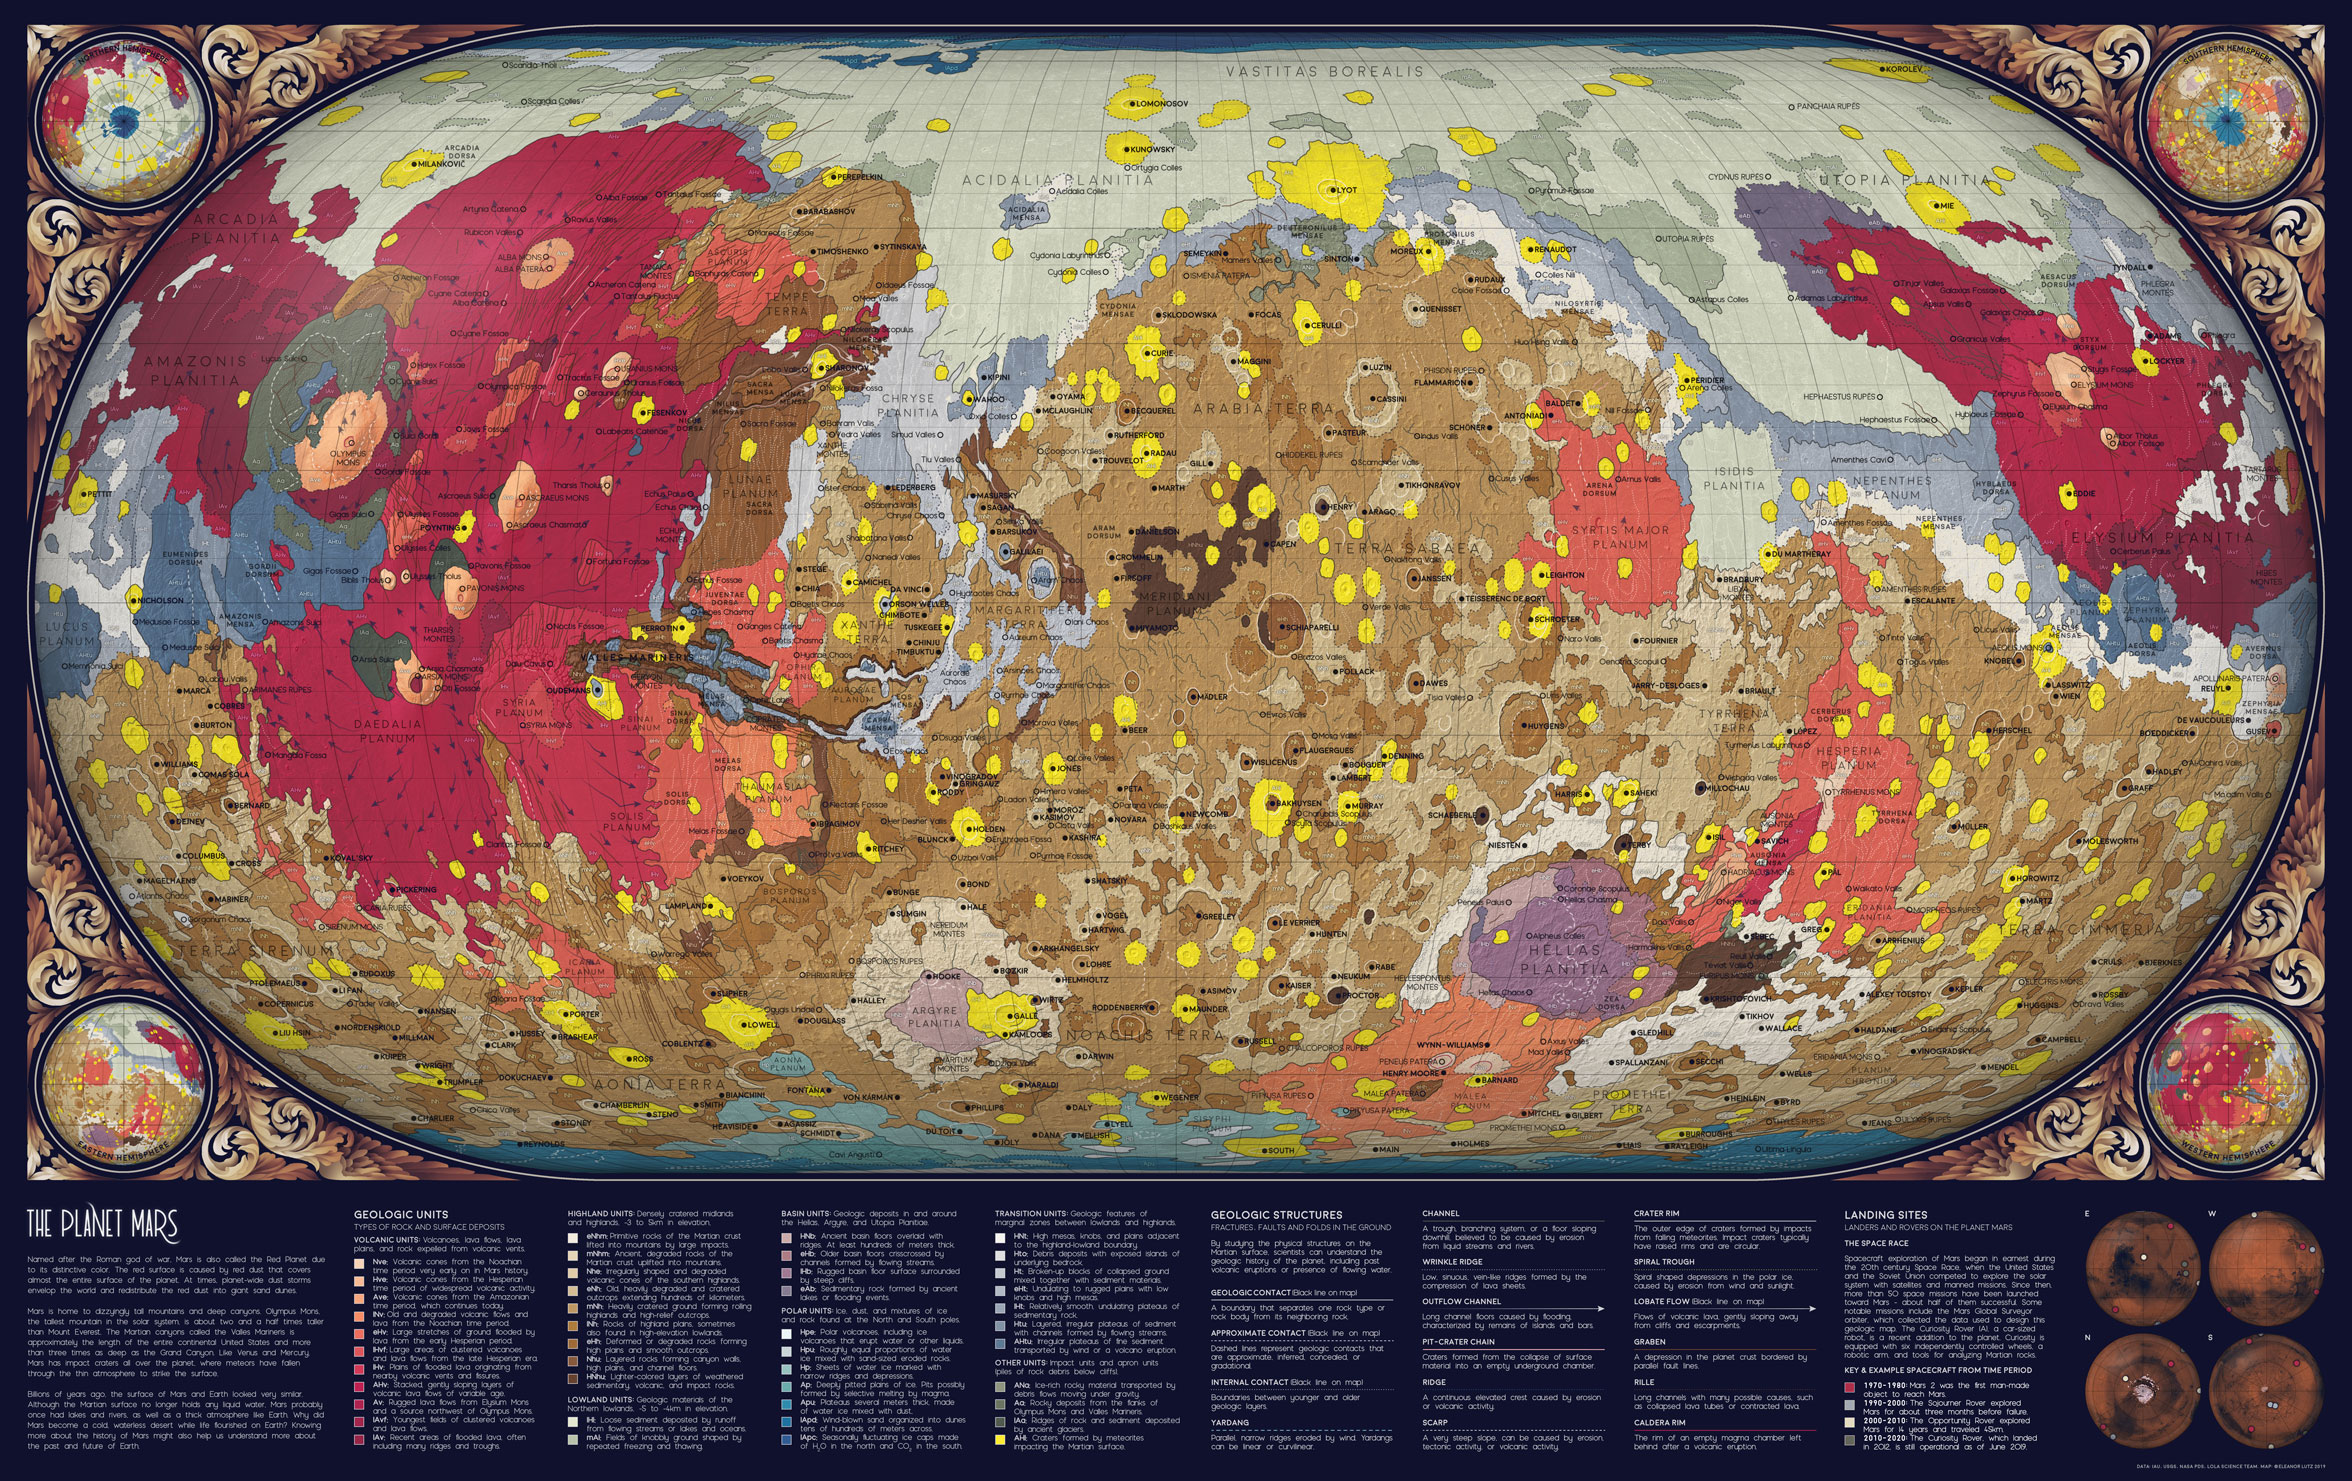
This week’s map is an artistic rendition of the geologic map of Mars designed by the USGS. I used the same geology data as the original map, but I added more topographic and label data, redesigned the visual style, and also edited the key for a more general audience.
One of the most difficult parts of making this map was translating the key into plain English. The original USGS map was designed for geologists, so I had to look up almost all of the vocabulary. For example, my abbreviated definition for a caldera rim was “The rim of an empty magma chamber left behind after a volcanic eruption.” The original description was “Ovoid scarp, outlines single or multiple coalesced partial to fully enclosed depression(s); volcanic collapse, related to effusive and possibly explosive eruptions.”
In many cases my translated labels were approximate or less informative than the original, so I decided to also include the original acronyms for each type of geologic unit. These labels can be cross-referenced to the original data to learn more about each type of geologic formation in scientific terms.
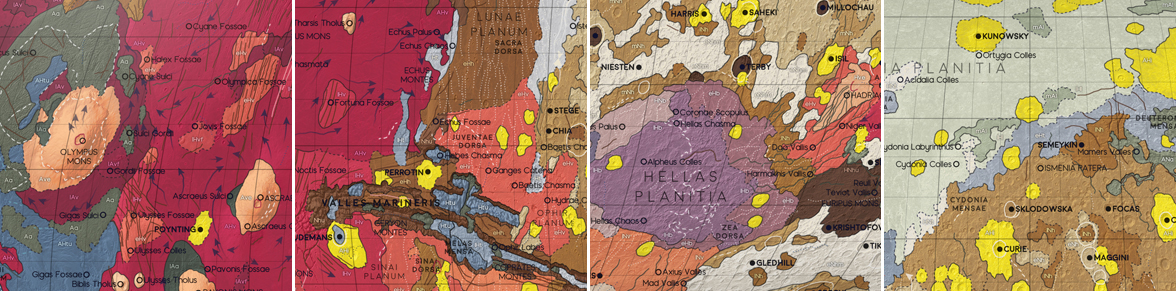
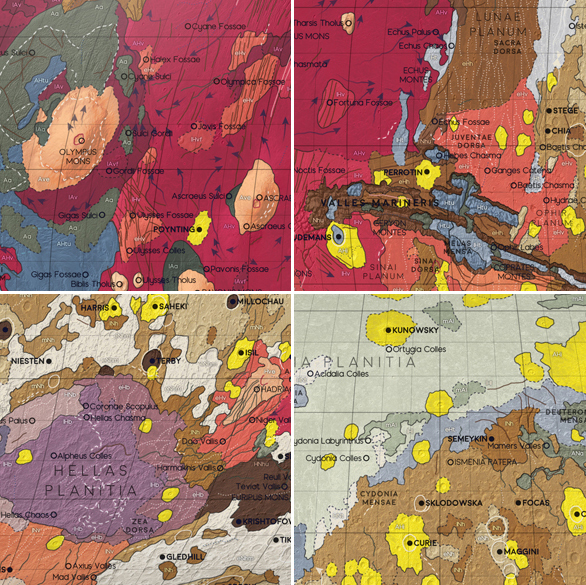 Some of the distinctive geologic features on Mars. 1: Olympus Mons, the largest volcano in the Solar System. 2: Valles Marineris, a deep canyon system more than 4000km long. 3: Hellas Planitia, the largest visible impact crater in the Solar System. 4: Mars is divided geologically into the Northern lowlands (pale green) and Southern highlands (brown). Impact craters formed by colliding asteroids and comets (neon yellow) are scattered across the planet.
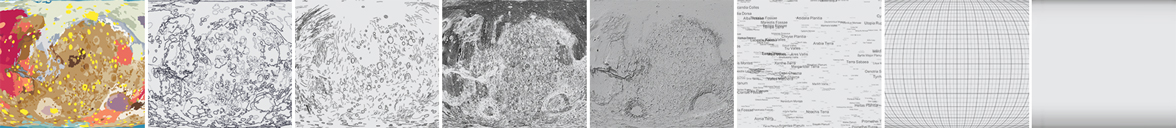
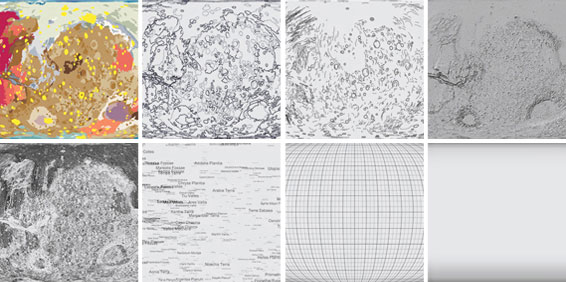 The individual layers used to make this map. 1-3: Geologic units, geologic contacts, and geologic features from the USGS dataset. 4-5: Hillshade and slope from a different USGS elevation dataset. 6: Nomenclature from NASA IAU. 7-8: Gridlines and a custom 3D effect designed in Photoshop.
I also spent a long time trying out different map projections for this design. I wanted to accurately show how much of the planet was made up of each geologic formation, so in the end I decided to use an Eckert IV equal-area projection. This type of map distorts object outlines, but it preserves the relative area of shapes across the globe. Eckert IV is not great for visualizing the polar regions, so I also added four inset maps to the corners to show each hemisphere of Mars (North, South, East, and West).

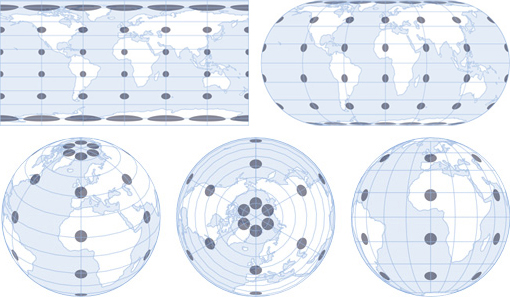 To map a 3D object in 2D space, the surface must be transformed using a map projection. There are many different projections, and for the maps in the Atlas of Space series I used Eckert IV, Orthographic, and Plate Carrée projections. To compare these different map projections, you can use a Tissot’s indicatrix - a set of circles of the same size plotted at different places on the globe. All map projections distort space, but you can see that the effects are quite different depending on the projection. 1: Plate Carrée. 2: Eckert IV. 3-5: Orthographic projections centered at different longitudes and latitudes.
-
Sources
- Data: Gazetteer of Planetary Nomenclature, International Astronomical Union (IAU). © 2019 Working Group for Planetary System Nomenclature (WGPSN). Planetary Symbology Mapping Guidelines, Federal Geographic Data Committee. Mars HRSC MOLA Blended DEM Global 200m v2. © 2018 NASA PDS and Derived Products Annex. USGS Astrogeology Science Center. Geologic Map of Mars SIM 3292. Kenneth L. Tanaka, James A. Skinner, Jr., James M. Dohm, Rossman P. Irwin, III, Eric J. Kolb, Corey M. Fortezzo, Thomas Platz, Gregory G. Michael, and Trent M. Hare. © 2014 USGS. Viking Global Color Mosaic 925m v1. © 2019 NASA PDS. Missions to Mars. © 2019 The Planetary Society. Reference texts: Astronomy, Andrew Fraknoi, David Morrison, Sidney C. Wolff et al. © 2016 OpenStax. Fonts: The labels on this map are typeset in Moon by Jack Harvatt. The title font is RedFlower by Type & Studio. Advice: Thank you to Henrik Hargitai, Oliver Fraser, Thomas Mohren, Chris Liu, Chloe Pursey, and Leah Willey for their helpful advice in making this map.
© This work is shared under a Creative Commons Attribution-NonCommercial-NoDerivatives 4.0 International License.