The map of medical statistics
November 2 2016 · A collaboration with Nerdcore Medical
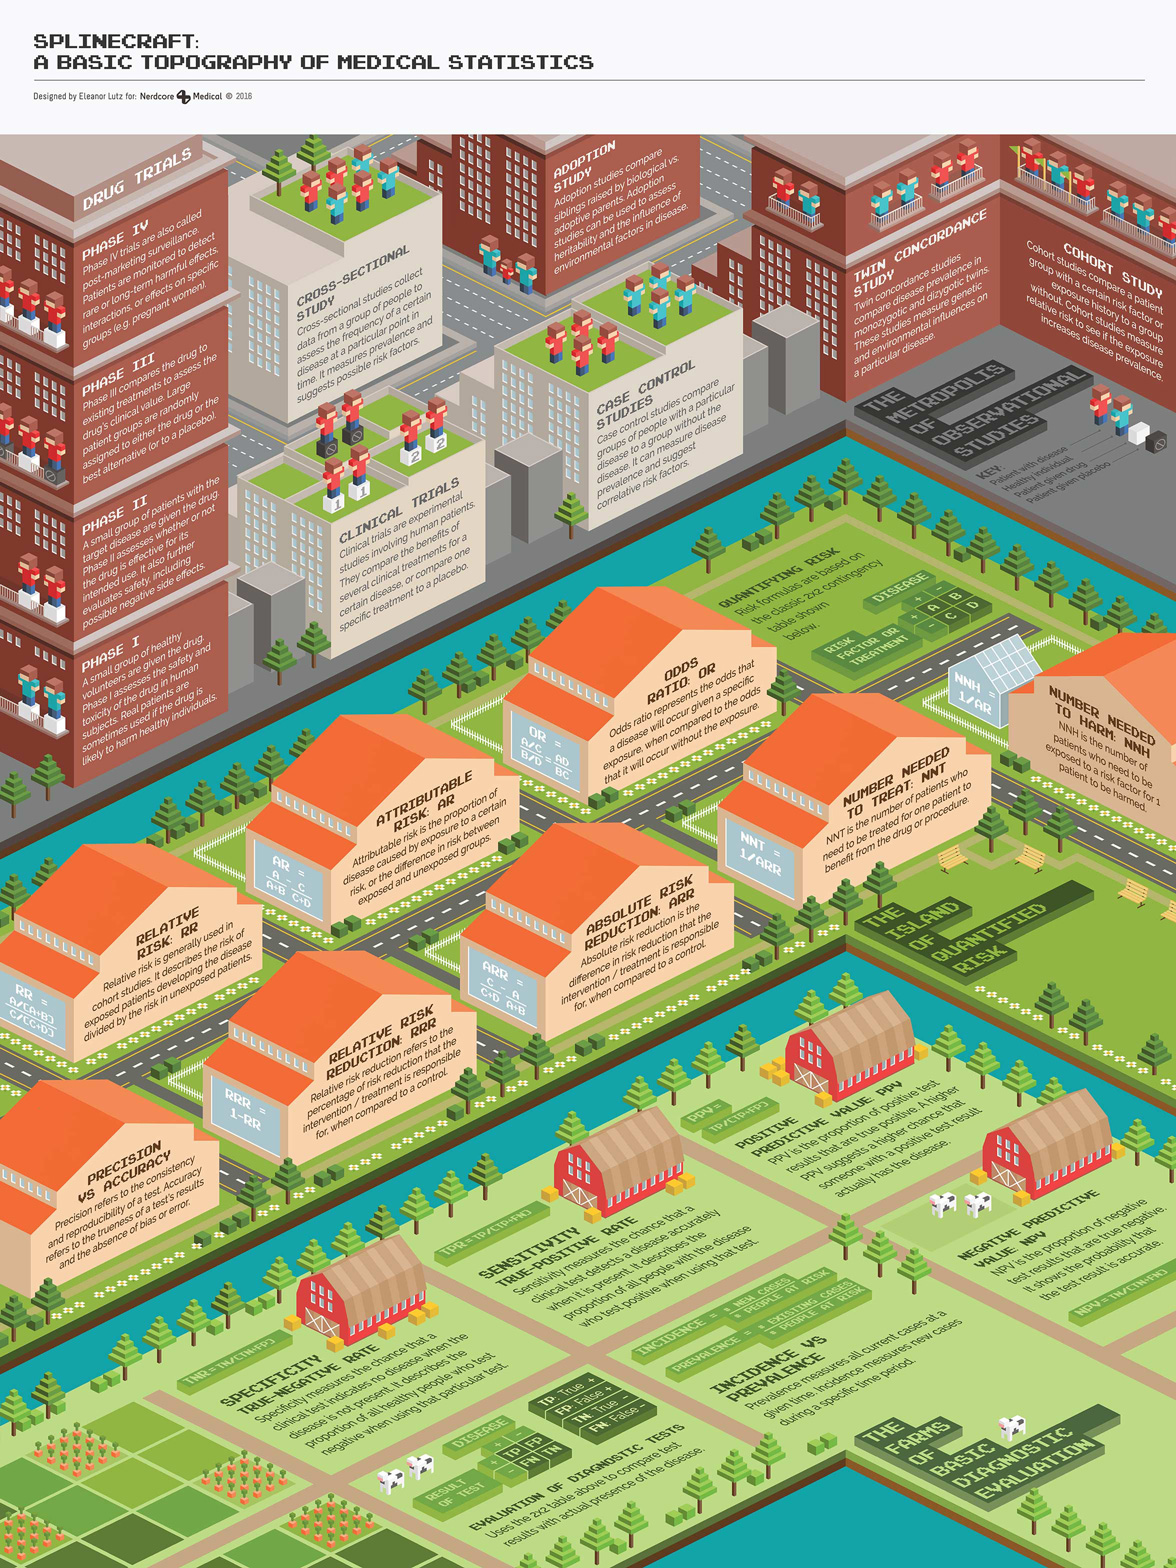
This week’s medical infographic poster explains common medical statistics terms. Since statistics is a little lacking in the illustration department (compared to anatomy or chemical reactions), I got to have a lot of creative freedom with the project.
I knew I wanted to illustrate all of the drug trial types with actual people, so I pitched the project as an isometric “Land of Observational Studies.” At first I wasn’t planning on a river divide between the three sections of the poster, but after talking with Arun I really liked his idea to emphasize the differences in complexity between sections.
I think most people work on isometric art in vector programs like Illustrator, but I decided to draw this particular poster in Photoshop. I laid out an isometric grid for reference, and then filled in each of the buildings following the reference grid. The pixel cows are probably my favorite decoration.
-
Sources
- First Aid for the USMLE Books 1 & 2 (2015). Tao Le and Vikas Bhushan. © 2014 McGraw-Hill Education.
- Fonts: Pixel Emulator by Pixel Saga.
© This work is owned by Nerdcore Medical. Please email Eleanor Lutz for press & design questions, and Arun Mathews for business & resale inquiries.