Leveling up
December 14 2016 · A collaboration with Nerdcore Medical
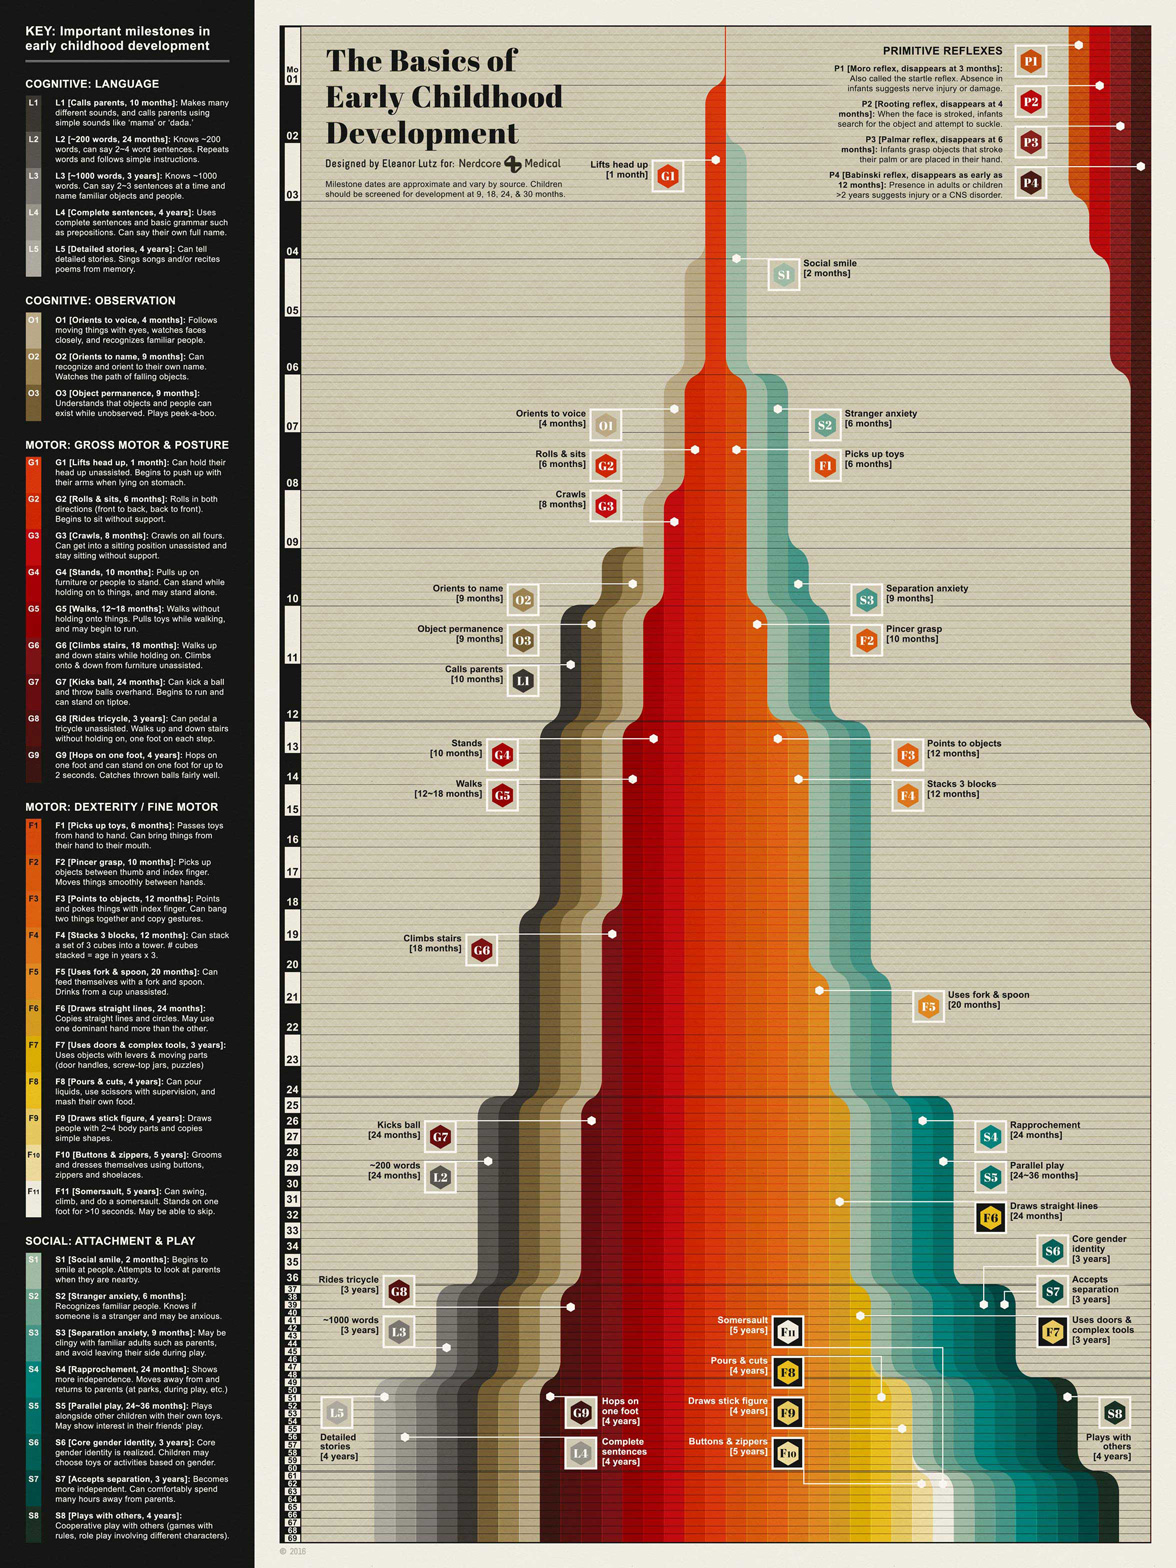
This week’s infographic is a design about child development. I wanted to create a easy-to-read guide that would be helpful for both medical students and new parents. The infographic has a quick summary of each developmental milestone on the right panel, and a more in-depth numbered overview on the left panel. The goal was to make a chart that would be both useful and visually interesting.
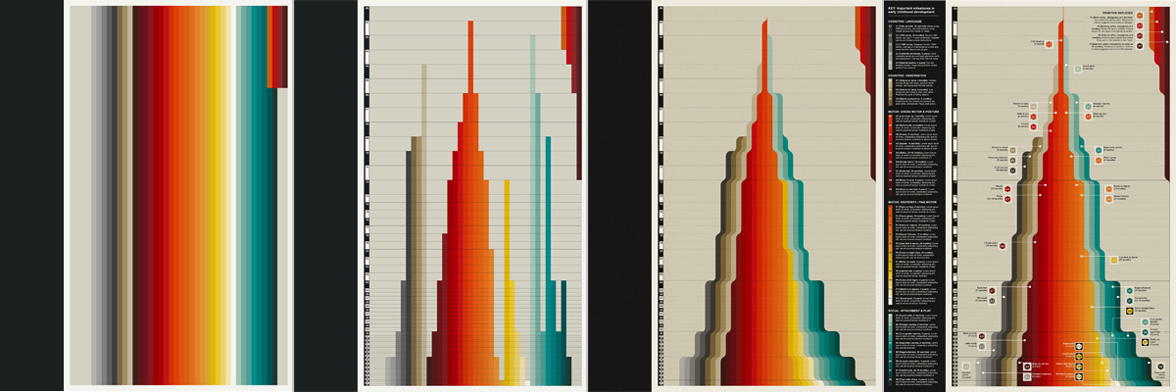
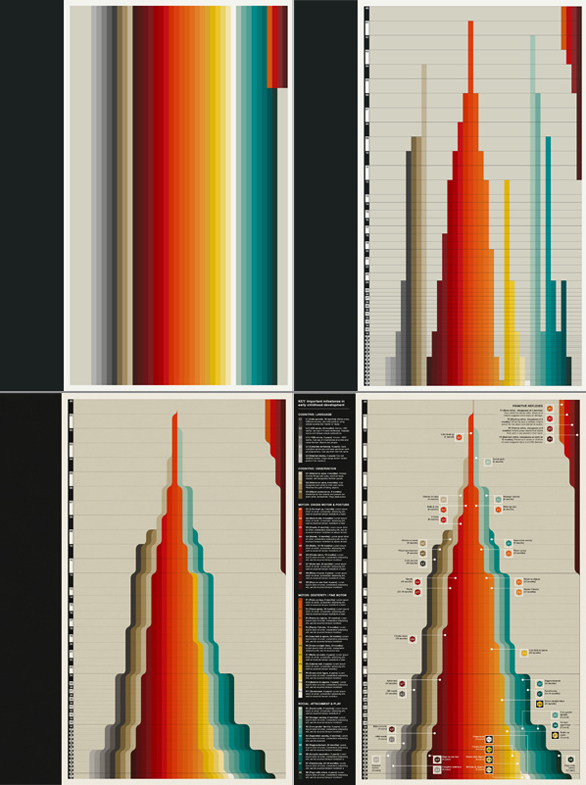 Since a lot development milestones depend on earlier skills, I decided to stack each skill onto all of the previous ones in a waterfall-style area graph. To make this design I first organized each of the child-development milestones and picked a gradient of colors to match each category (process images are shown above). Then I made a custom timeline and cut each milestone color line at the correct time point. Finally I shifted each of the timeline colors to the center so that the entire design looked like a waterfall. I debated for a while where to put the detailed descriptions for each development stage, but I finally settled on a left sidebar to keep things less cluttered in the main section.
One of the unique customizations of this design is the nonlinear timeline. A third of the developmental milestones happen within the first 12 months, and increasing the spacing for the first few years helped emphasize these earlier years of development.
As with my other medical infographics, Dr. Arun Mathews, a Chief Medical Officer in Texas, fact-checked my work and suggested useful articles.
-
Sources
- First Aid for the USMLE Books 1 & 2 (2015). Tao Le and Vikas Bhushan. © 2014 McGraw-Hill Education. Neural mechanism and clinical significance of the plantar grasp reflex in infants. Futagi et al. Pediatr Neurol. 2010 Aug;43(2):81-6. doi: 10.1016. CDC & NIH National Library of Medicine: Moro reflex, Babinski reflex, Important milestones: Your Child By Five Years.
- Fonts used: Abril Fatface by TypeTogether and Arial.
© This work is owned by Nerdcore Medical. Please email Eleanor Lutz for press & design questions, and Arun Mathews for business & resale inquiries.