An animated chart of 42 North American butterflies
August 27 2014
Last week’s infographic was pretty science intensive, so this one is a bit more frivolous for a change. I checked out six butterfly field guides from the library and picked out some of the species I thought were the most unique and beautiful. It’s meant as a chart of decorative species illustrations rather than an educational infographic. So it doesn’t have as much information as my other posts, but I did draw everything as true to life as I could. The book I used the most for this project was Butterflies of North America by Brock JP and Kaufman K.
An animated guide to the human body : The muscle edition
August 12 2014
I love GIFs as an art form, so this month I tried making an infographic GIF. It’s a 25-frame stop motion animation made mostly in Photoshop. I’ve never made an animation this complex before, and I had a ton of fun with it. I’m definitely planning on more animated infographics in the future. I might even learn After Effects, though I’ll have to see how feasible that is since my computer’s getting kind of old and slow. As always, critiques and comments are very welcome.
-
Acknowledgements
- The majority of the information used in this post comes from the textbook Biological Science, 4th Edition by Scott Freeman.
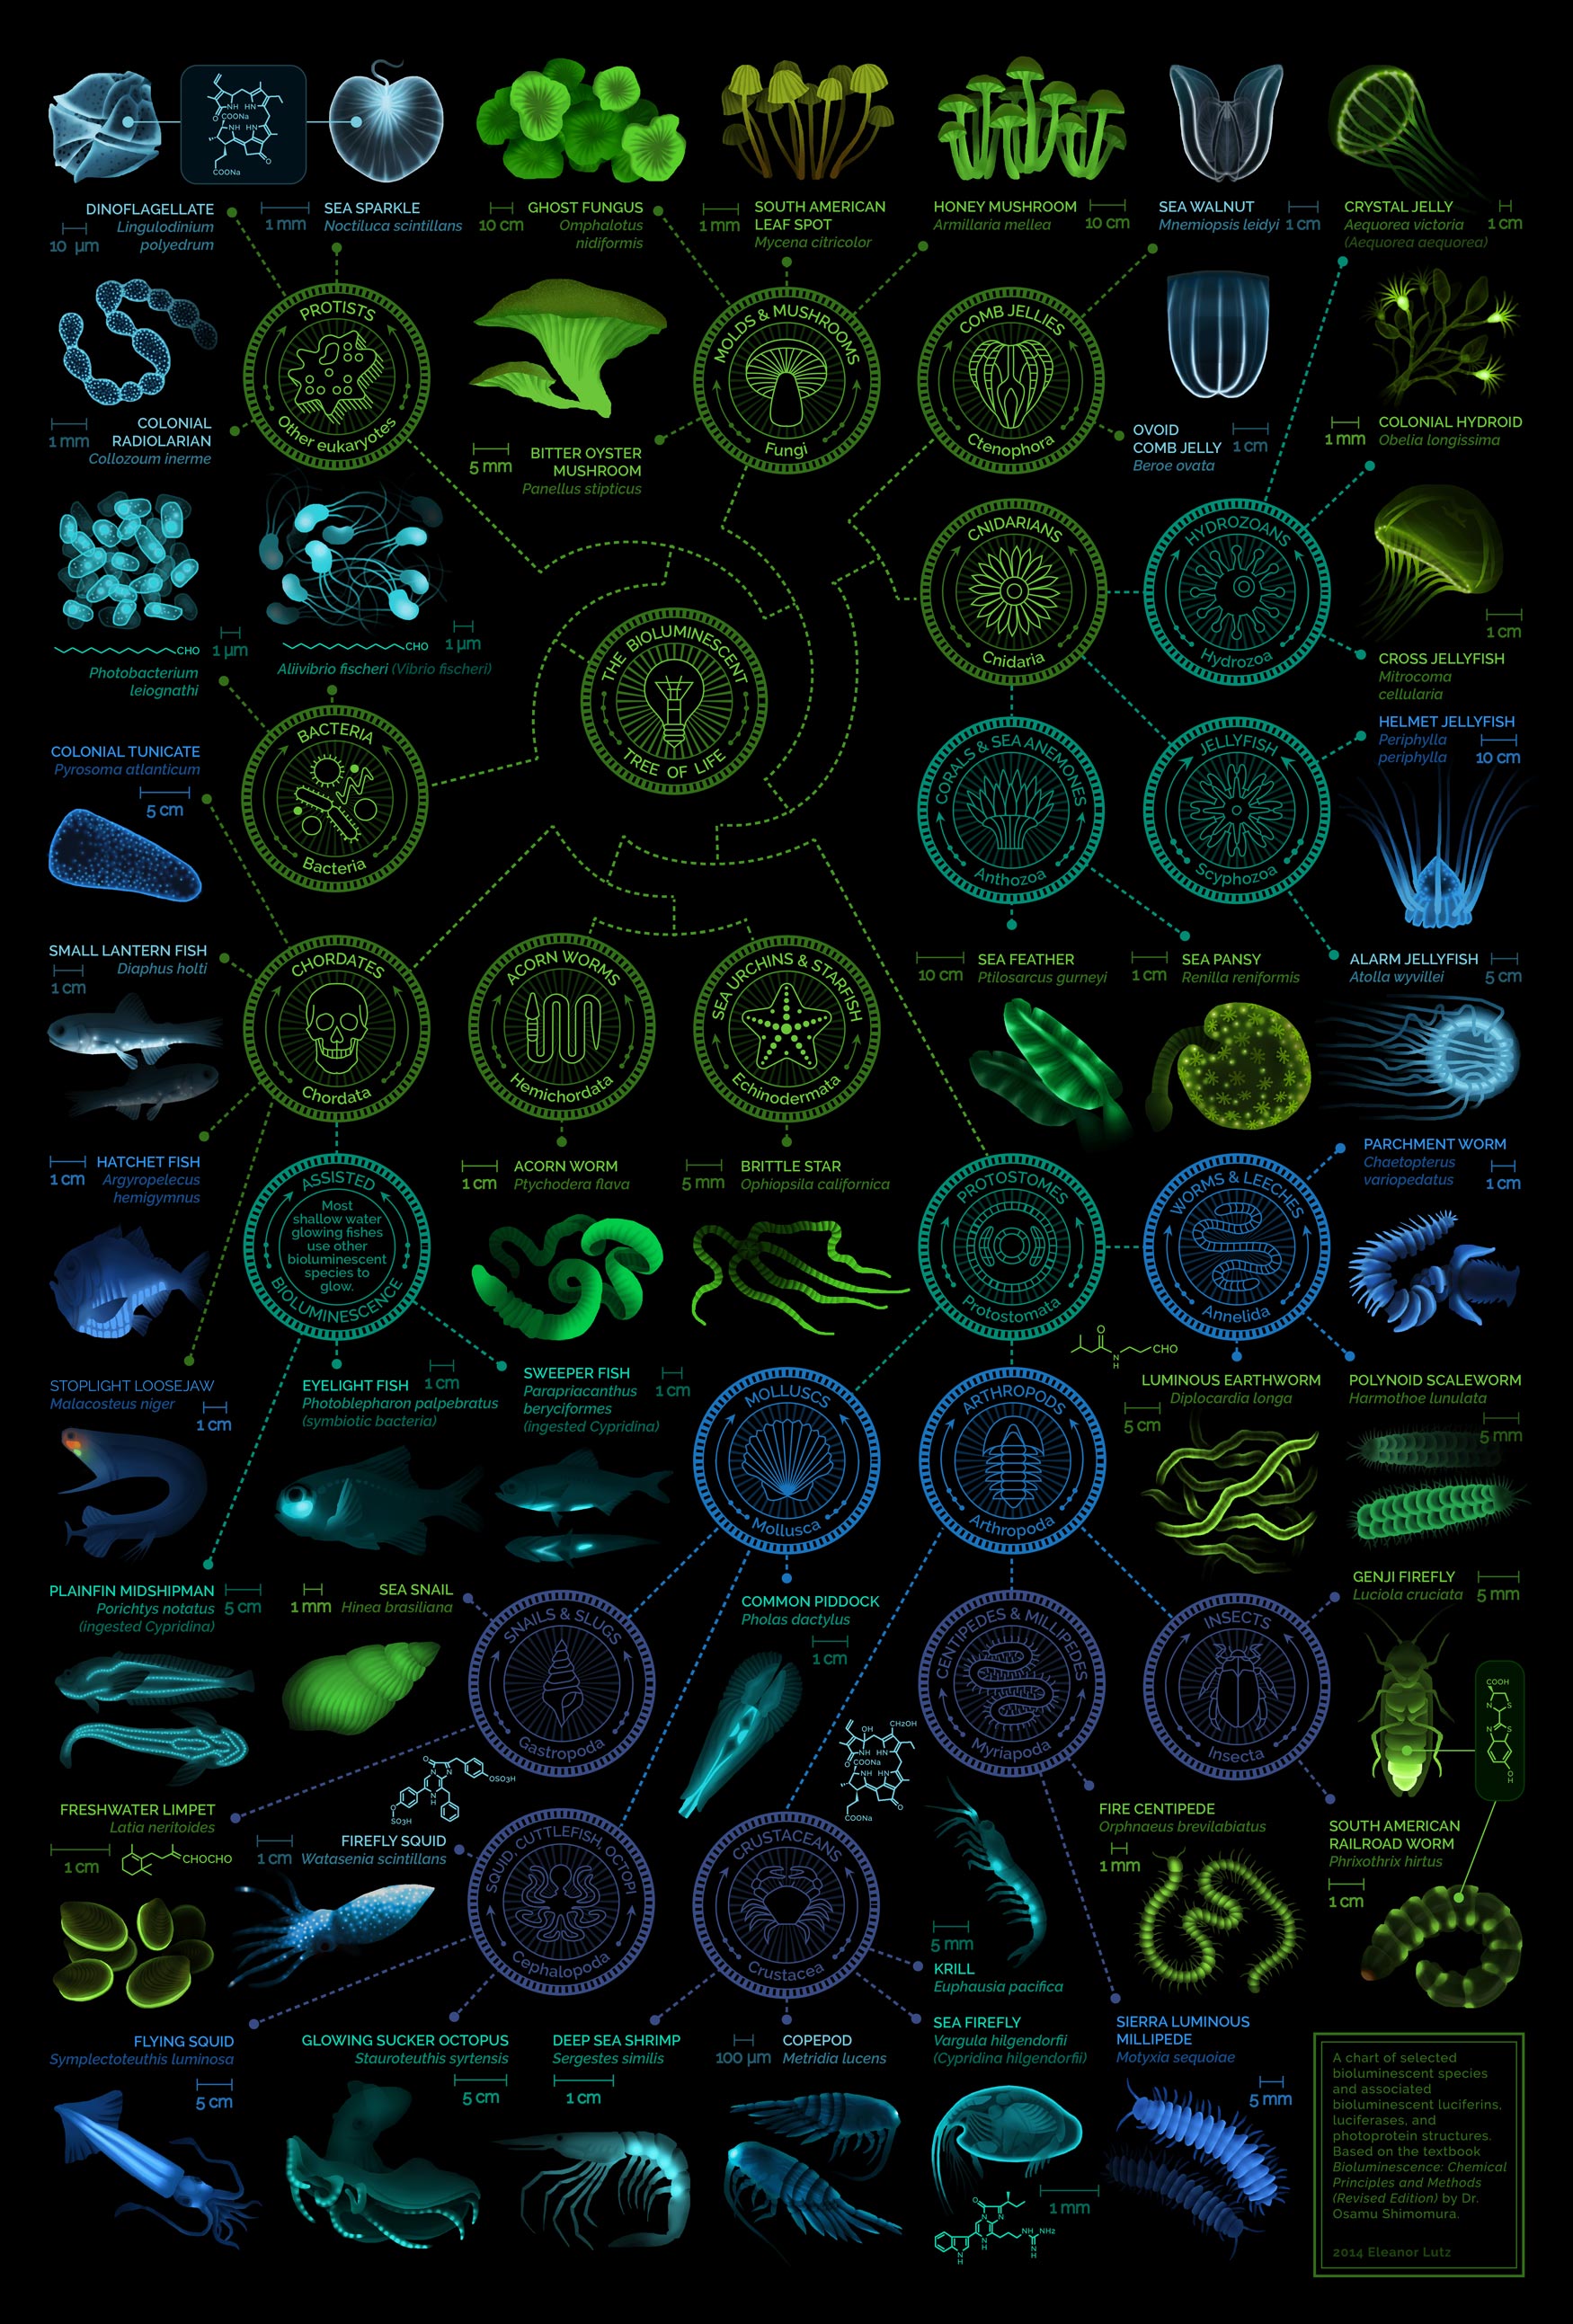
A visual compendium of glowing creatures
July 21 2014
Hello! My name is Eleanor and I’m a self-employed artist from Seattle. This blog post is the first installment of what will hopefully be a year-long infographic design project. I’ve always been into biology and design, so I’m taking a year off after college to see if I can combine the two with at least marginal success.
It’s more of an experiment than anything else, so feel free to leave comments about what works, what doesn’t, and what might be scientifically incorrect despite my best efforts. I spend a lot of time trying to make these infographics accurate (for this post I read a 468 page textbook and used over 200 other sources) but naturally I’m not an expert in every subject I write about. Today’s post diagrams a few of the most well studied bioluminescent organisms. Hope you enjoy it, and thanks for stopping by :)
Acknowledgements
- Thank you to bioluminescence researcher Steven Haddock for his help with animal physiology, and to evolutionary biologist Jordi Paps for his help with phylogeny.
- The majority of the information used in this chart comes from the textbook Bioluminescence: Chemical Principles and Methods (Revised Edition) by Osamu Shimomura.